Hearthy Foods: the customers behind 30% growth
The CEO asked who was buying the company's new gluten-free flours; answering meant understanding the company first, then its customers, and the answer became a strategy covered in Bon Appétit.
At a glance
- Role
- Lead UX researcher, UX Research Associates. Strategy, fieldwork and synthesis.
- Client
- Hearthy Foods, a Southern California food manufacturer moving into e-commerce with a line of gluten-free flours
- Methods
- Stakeholder ethnography, an analytics stack, a survey of more than 100 customers, ten segmented interviews, personas, card sorting, journey mapping
- Outcome
- 30% revenue growth and a 5%+ conversion lift in 2020, a recipe-first content strategy covered in Bon Appétit, and a rebrand of mission and vision around the research
Summary
Hearthy's CEO wanted to know who was buying the flours, why, and how to reach them. Before asking customers anything, I spent time inside the business and found a manufacturer running an e-commerce channel on retail habits, with two stores whose data nobody was reading. I set up the analytics first, then ran a survey of more than 100 customers, ten interviews, a card sort and a journey map. Three personas came out of it, and one finding ran through all of them: customers shop by diet, and the site wasn't organized that way. Hearthy rebuilt its content and navigation around recipes and diets, grew revenue 30% in 2020, and earned coverage in Bon Appétit.
What the team got
- Three personas
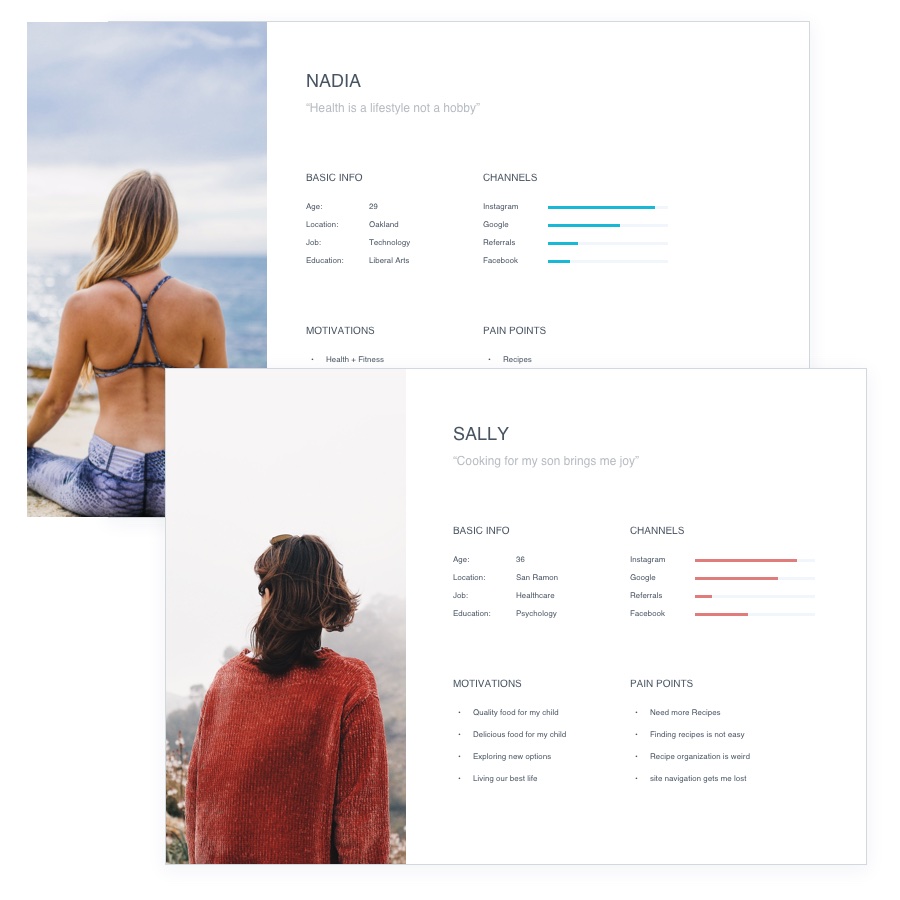
- Sally, who cooks for her child. Nadia, who wants a healthy lifestyle. Preethi, who needs variety within an autoimmune protocol diet. Built from the survey numbers and the interview stories, and used for web copy, layout and product development.
- A customer journey map
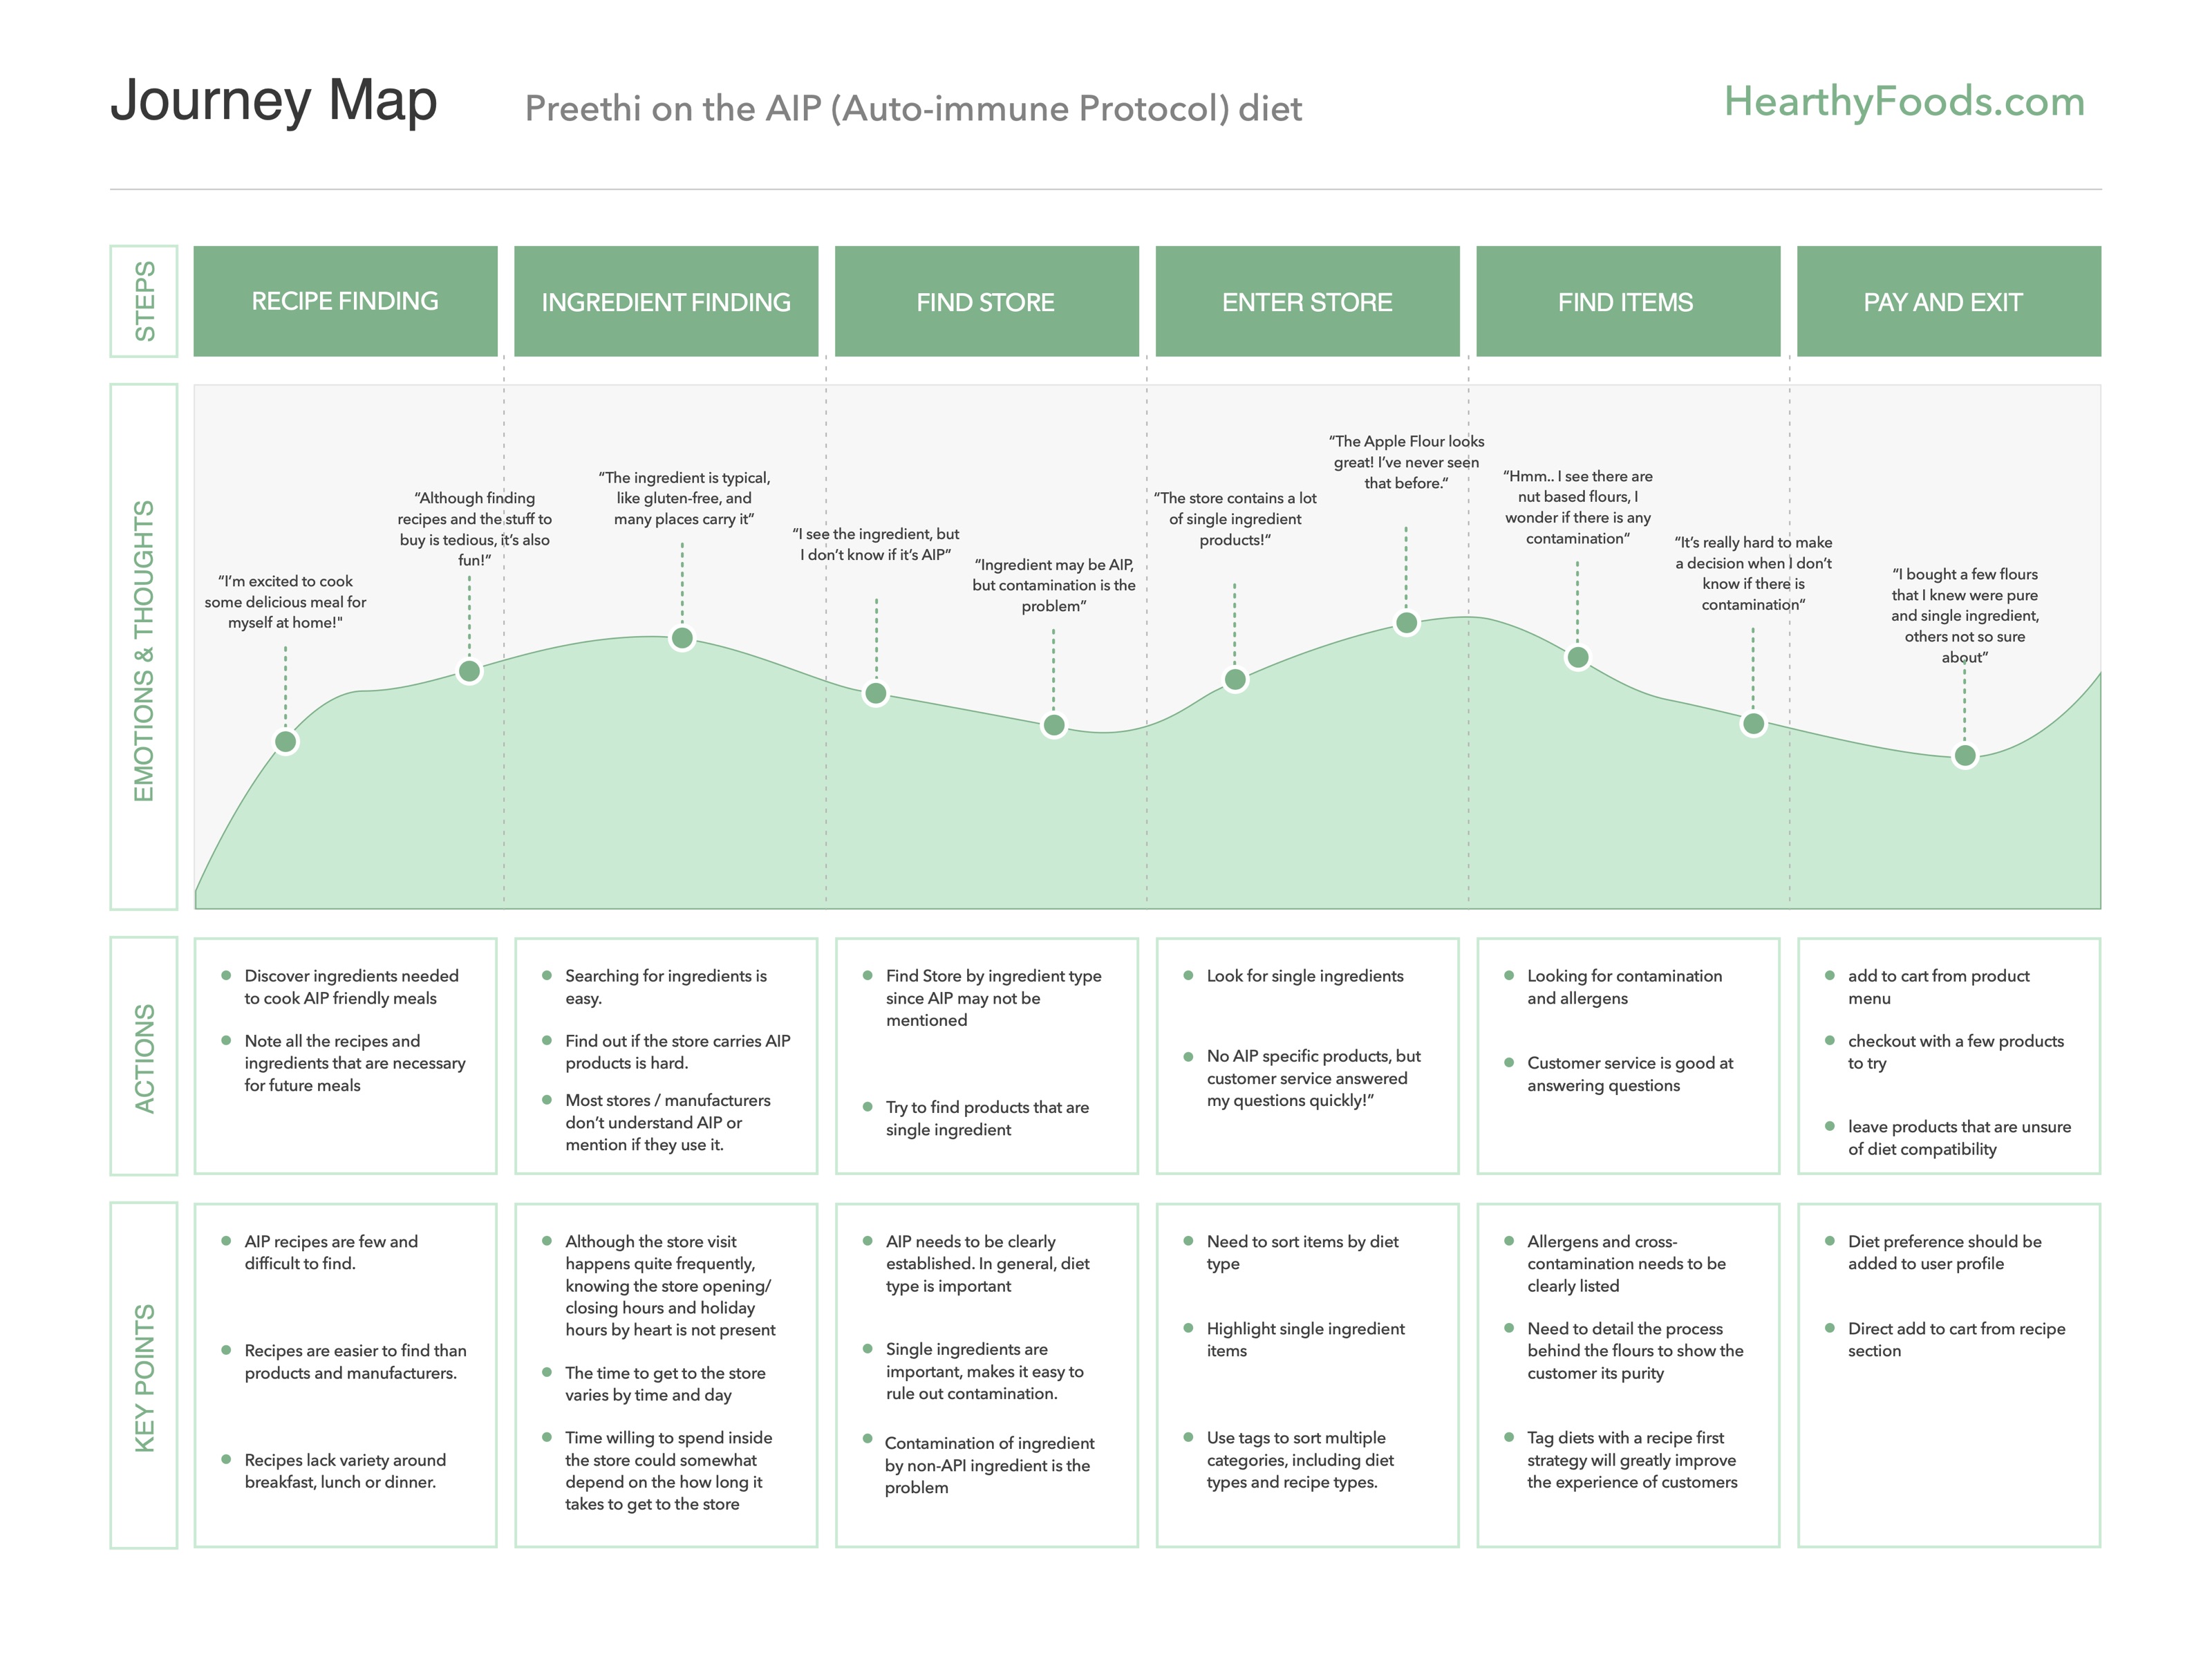
- Preethi's path from finding a recipe to checking out, with an emotion curve and her own words at each step, showing where the site lost her.
- An information architecture
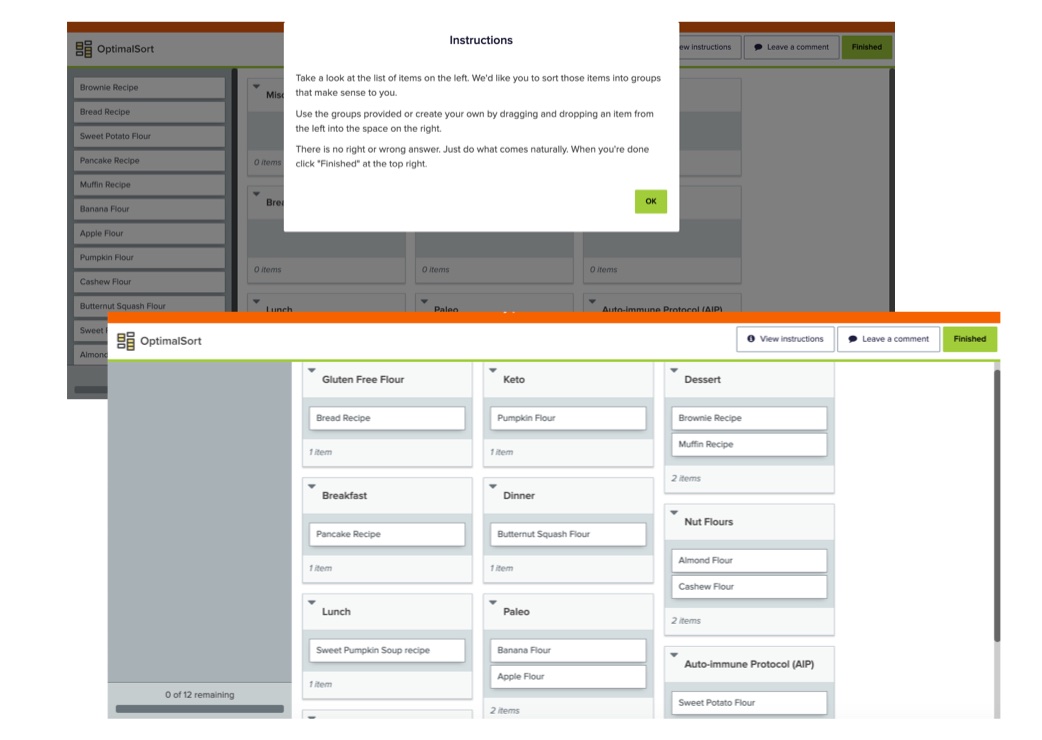
- Card-sort groupings by diet and by meal, and a tree test showing where the existing navigation sent people the wrong way.
- An analytics stack the company owns
- Google Analytics, UserTesting.com, Treejack and OptimalSort, Helium 10 and Jungle Scout, and A2X feeding Shopify and Amazon sales into QuickBooks by SKU.
- Recommendations sorted by impact and effort
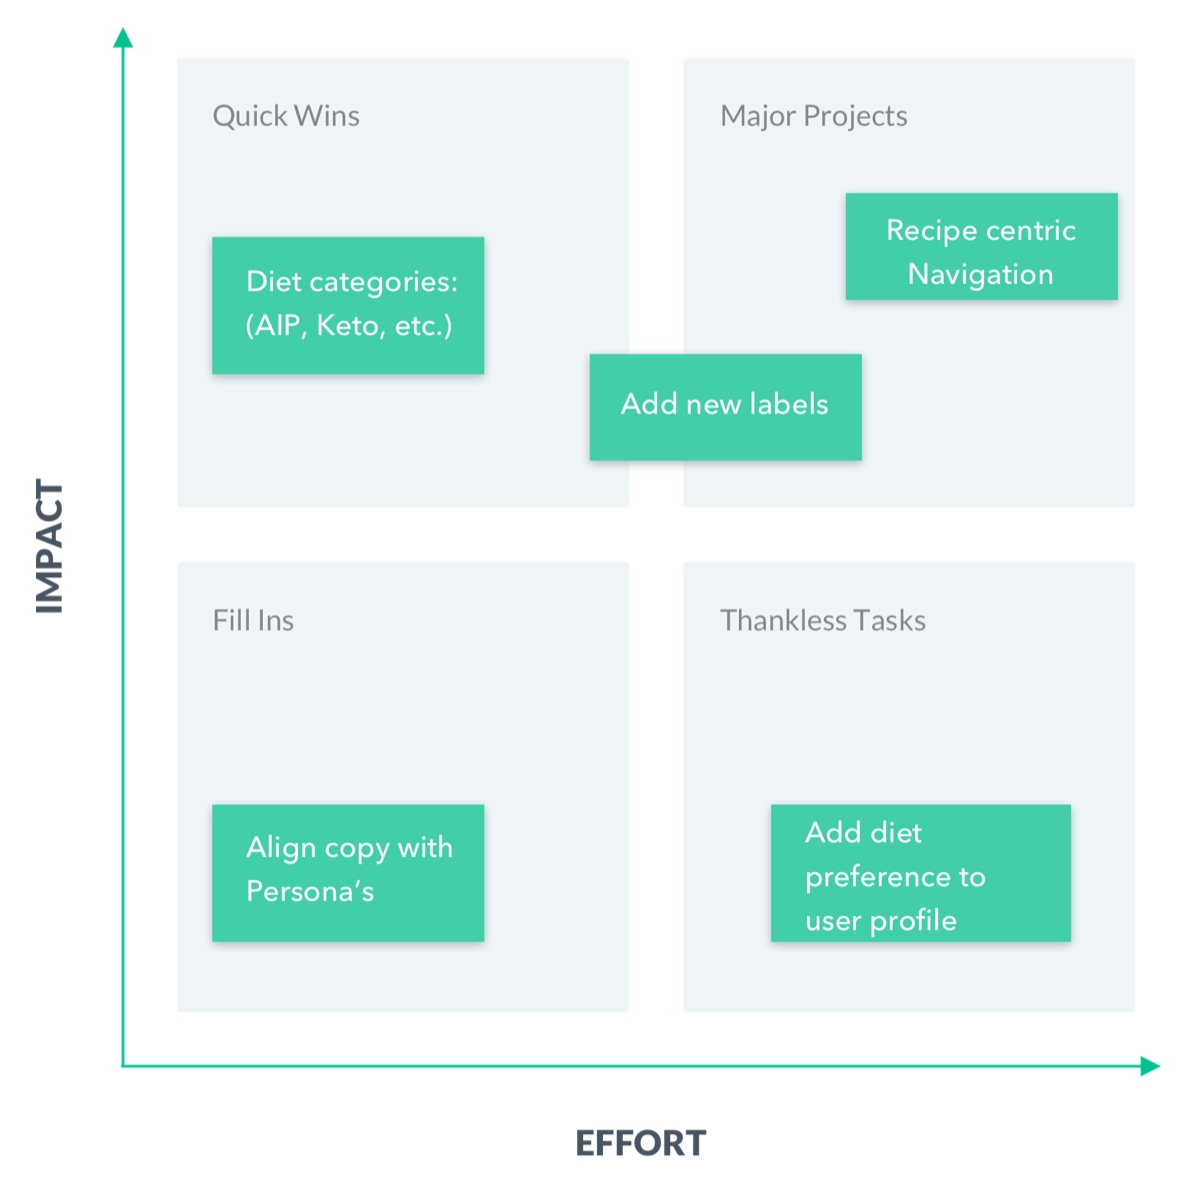
- Diet categories as the quick win, recipe-centric navigation as the major project, and a readout the leadership team used to rebrand.
The work
Start with the stakeholders
Before researching customers, I spent time with the business: shadowing everyone from the CEO to the people on the manufacturing line, and asking broad questions about processes and goals. Ethnography starts with empathy, for stakeholders as much as customers, and it lets the questions nobody has asked yet come to the surface.
Hearthy sold cheesecakes and pies through local grocery stores and had recently added a line of gluten-free flours online. The CEO asked three questions: who is buying the flours, why, and how can we reach them better? I added a fourth: how do the flours fit the overall business and customer base?
What the strategic research found
Hearthy was a manufacturer, not an e-commerce company. Sales and marketing were built for the retail channel and were now doing double duty online. There was an Amazon store and a Shopify site, but the data wasn't integrated and nobody was running analytics.
An analytics stack first
I recommended, and helped implement, a stack that let Hearthy collect and use its own data:
- Google Analytics for audience and traffic. It showed that 65% of customers were women aged 27 to 40, and that site conversion was below the industry average.
- UserTesting.com for website usability testing.
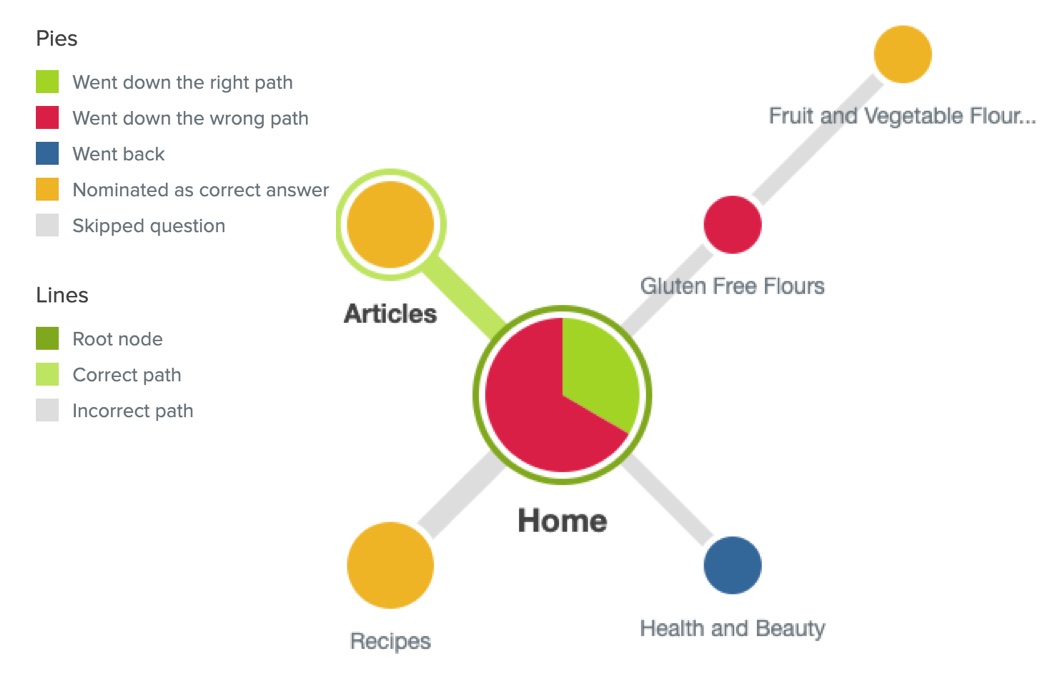
- Treejack and OptimalSort for information architecture and remote card sorting, which simplified the flour listings and organized recipes.
- Helium 10 and Jungle Scout for sales volume, keyword and competitive data.
- A2X to bring Shopify and Amazon sales into QuickBooks, so sales could be tracked by SKU.
A wide-net survey
More than 100 customers answered questions on demographics, lifestyle, health and gluten-free buying habits, how they found Hearthy, and which influencers they followed. The headline: mostly female customers with household incomes over $80,000, and a loud request for more recipes.
Ten segmented interviews
Twenty-five-minute phone interviews with customers who bought only flour, or bought it only once. The questions were about their lives: their day, their weekends, their favorite foods and recipes. The survey supplied the numbers; the interviews supplied the people.
Three personas
Sally, who needs products for her child. Nadia, who wants a healthy lifestyle. Preethi, who needs variety within an autoimmune protocol (AIP) diet. The personas shaped web copy, a recipe-first layout and product development.
Card sorting and the customer journey
Participants grouped recipes by meal, by sweet versus savory, and above all by diet: keto, AIP, paleo and nut-free. Customers searched for flours through their diet. AIP shoppers were the most frustrated, and there was no AIP content at all.
The recommendations: tag every product and recipe by diet, show matching recipes under each flour, merge the blog and recipe sections, simplify the home page, and write more recipes, especially for AIP.
What changed
Personas, journey maps and the recipe-first redesign drove 30% revenue growth in 2020 and a conversion lift of more than 5% on a site that had been converting below the industry average. Hearthy began rebranding its mission and vision around the research. Content was rebuilt around the personas and diet profiles, including AIP, keto and paleo, and a recipe-centered site made products easier to find. The recipe-first content strategy earned coverage in Bon Appétit.
What carries over
- Understand the business before the customer. The first finding was about Hearthy, not its buyers: a manufacturer running e-commerce on retail habits. Every customer finding landed differently once that was clear.
- Instrument before you ask. The analytics stack came first, so the survey and interviews filled gaps the data couldn't, rather than guessing at numbers the data already had.
- Let the numbers and the people check each other. The survey said who; the interviews said why. Neither alone would have produced Preethi.
- Organize the product the way people search for it. Customers shopped by diet. The site was organized by product. Closing that gap was the quick win and the major project both.